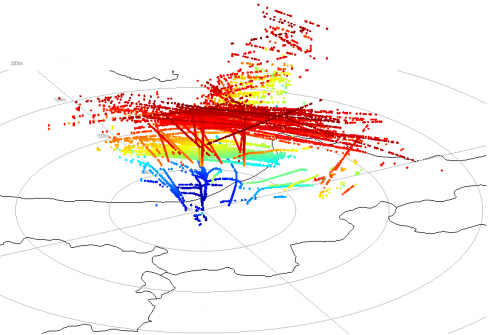
Over on Reddit user JorgeGT has posted an animated 3D visualization of his local ADS-B air traffic data using a MATLAB script he wrote. The script collects data from a dump1090 server. If you have a copy of MATLAB, his code can be downloaded from Github here. To run the code JorgeGT writes that you’ll need to do the following.
- Get dump1090 running on an accessible server: http://url:8080.
- Get countries/states/provinces SHPs from Natural Earth if you want them to show them and store them in a folder called 10m_cultural.
- Have a look at my MATLAB script and try to run it.
The post Visualizing ADS-B Data in 3D using MATLAB appeared first on rtl-sdr.com.